Excel Chart formatting
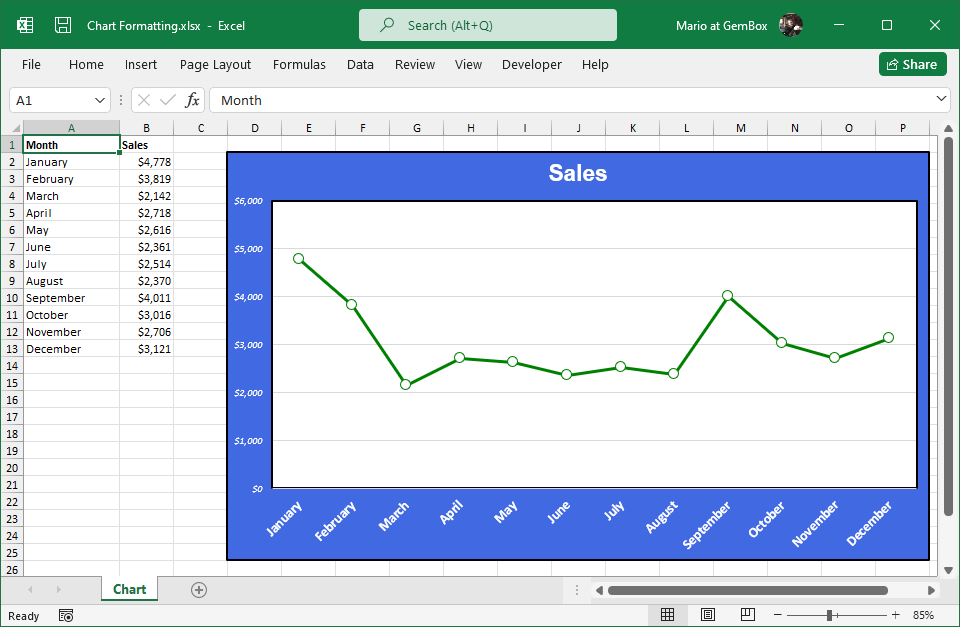
The following example shows how to format an Excel chart in C# and VB.NET using GemBox.Spreadsheet.
using GemBox.Spreadsheet;
using GemBox.Spreadsheet.Charts;
using GemBox.Spreadsheet.Drawing;
using System;

class Program
{
    static void Main()
    {
        // If using the Professional version, put your serial key below.
        SpreadsheetInfo.SetLicense("FREE-LIMITED-KEY");

        var workbook = new ExcelFile();
        var worksheet = workbook.Worksheets.Add("Chart");

        // Add data which will be used by the Excel chart.
        worksheet.Cells["A1"].Value = "Month";
        worksheet.Cells["A2"].Value = "January";
        worksheet.Cells["A3"].Value = "February";
        worksheet.Cells["A4"].Value = "March";
        worksheet.Cells["A5"].Value = "April";
        worksheet.Cells["A6"].Value = "May";
        worksheet.Cells["A7"].Value = "June";
        worksheet.Cells["A8"].Value = "July";
        worksheet.Cells["A9"].Value = "August";
        worksheet.Cells["A10"].Value = "September";
        worksheet.Cells["A11"].Value = "October";
        worksheet.Cells["A12"].Value = "November";
        worksheet.Cells["A13"].Value = "December";

        // Fill the values.
        worksheet.Cells["B1"].Value = "Sales";
        var random = new Random();

        for (int i = 1; i <= 12; i++)
            worksheet.Cells[i, 1].SetValue(random.Next(2000, 5000));

        // Set header row and formatting.
        worksheet.Rows[0].Style.Font.Weight = ExcelFont.BoldWeight;
        worksheet.Columns[0].SetWidth(3, LengthUnit.Centimeter);
        worksheet.Columns[1].Style.NumberFormat = "\"$\"#,##0";

        // Make entire sheet print on a single page.
        worksheet.PrintOptions.FitWorksheetWidthToPages = 1;
        worksheet.PrintOptions.FitWorksheetHeightToPages = 1;

        // Create Excel chart and select data for it.
        var chart = worksheet.Charts.Add<LineChart>("D2", "P25");
        chart.SelectData(worksheet.Cells.GetSubrangeAbsolute(0, 0, 12, 1), true);

        // Define colors.
        var backgroundColor = DrawingColor.FromName(%BackgroundColor%);
        var seriesColor = DrawingColor.FromName(%SeriesColor%);
        var textColor = DrawingColor.FromName(%TextColor%);
        var borderColor = DrawingColor.FromName(DrawingColorName.Black);

        // Format chart.
        chart.Fill.SetSolid(backgroundColor);

        var outline = chart.Outline;
        outline.Width = Length.From(2, LengthUnit.Point);
        outline.Fill.SetSolid(borderColor);

        // Format plot area.
        chart.PlotArea.Fill.SetSolid(DrawingColor.FromName(DrawingColorName.White));

        outline = chart.PlotArea.Outline;
        outline.Width = Length.From(1.5, LengthUnit.Point);
        outline.Fill.SetSolid(borderColor);

        // Format chart title.
        var textFormat = chart.Title.TextFormat;
        textFormat.Size = Length.From(20, LengthUnit.Point);
        textFormat.Font = "Arial";
        textFormat.Fill.SetSolid(textColor);

        // Format vertical axis.
        textFormat = chart.Axes.Vertical.TextFormat;
        textFormat.Fill.SetSolid(textColor);
        textFormat.Italic = true;

        // Format horizontal axis.
        textFormat = chart.Axes.Horizontal.TextFormat;
        textFormat.Fill.SetSolid(textColor);
        textFormat.Size = Length.From(12, LengthUnit.Point);
        textFormat.Bold = true;

        // Format vertical major gridlines.
        chart.Axes.Vertical.MajorGridlines.Outline.Width = Length.From(0.5, LengthUnit.Point);

        // Format series.
        var series = chart.Series[0];
        outline = series.Outline;
        outline.Width = Length.From(3, LengthUnit.Point);
        outline.Fill.SetSolid(seriesColor);

        // Format series markers.
        series.Marker.MarkerType = MarkerType.Circle;
        series.Marker.Size = 10;
        series.Marker.Fill.SetSolid(textColor);
        series.Marker.Outline.Fill.SetSolid(seriesColor);

        workbook.Save("Chart Formatting.%OutputFileType%");
    }
}
Imports GemBox.Spreadsheet
Imports GemBox.Spreadsheet.Charts
Imports GemBox.Spreadsheet.Drawing
Imports System

Module Program

    Sub Main()

        ' If using the Professional version, put your serial key below.
        SpreadsheetInfo.SetLicense("FREE-LIMITED-KEY")

        Dim workbook As New ExcelFile()
        Dim worksheet = workbook.Worksheets.Add("Chart")

        ' Add data which is used by the Excel chart.
        worksheet.Cells("A1").Value = "Month"
        worksheet.Cells("A2").Value = "January"
        worksheet.Cells("A3").Value = "February"
        worksheet.Cells("A4").Value = "March"
        worksheet.Cells("A5").Value = "April"
        worksheet.Cells("A6").Value = "May"
        worksheet.Cells("A7").Value = "June"
        worksheet.Cells("A8").Value = "July"
        worksheet.Cells("A9").Value = "August"
        worksheet.Cells("A10").Value = "September"
        worksheet.Cells("A11").Value = "October"
        worksheet.Cells("A12").Value = "November"
        worksheet.Cells("A13").Value = "December"

        ' Fill the values.
        worksheet.Cells("B1").Value = "Sales"
        Dim random As New Random()

        For i As Integer = 1 To 12
            worksheet.Cells(i, 1).SetValue(random.Next(2000, 5000))
        Next

        ' Set header row and formatting.
        worksheet.Rows(0).Style.Font.Weight = ExcelFont.BoldWeight
        worksheet.Columns(0).SetWidth(3, LengthUnit.Centimeter)
        worksheet.Columns(1).Style.NumberFormat = """$""#,##0"

        ' Make entire sheet print on a single page.
        worksheet.PrintOptions.FitWorksheetWidthToPages = 1
        worksheet.PrintOptions.FitWorksheetHeightToPages = 1

        ' Create Excel chart and select data for it.
        Dim chart = worksheet.Charts.Add(Of LineChart)("D2", "P25")
        chart.SelectData(worksheet.Cells.GetSubrangeAbsolute(0, 0, 12, 1), True)

        ' Define colors.
        Dim backgroundColor = DrawingColor.FromName(%BackgroundColor%)
        Dim seriesColor = DrawingColor.FromName(%SeriesColor%)
        Dim textColor = DrawingColor.FromName(%TextColor%)
        Dim borderColor = DrawingColor.FromName(DrawingColorName.Black)

        ' Format chart.
        chart.Fill.SetSolid(backgroundColor)

        Dim outline = chart.Outline
        outline.Width = Length.From(2, LengthUnit.Point)
        outline.Fill.SetSolid(borderColor)

        ' Format plot area.
        chart.PlotArea.Fill.SetSolid(DrawingColor.FromName(DrawingColorName.White))

        outline = chart.PlotArea.Outline
        outline.Width = Length.From(1.5, LengthUnit.Point)
        outline.Fill.SetSolid(borderColor)

        ' Format chart title.
        Dim textFormat = chart.Title.TextFormat
        textFormat.Size = Length.From(20, LengthUnit.Point)
        textFormat.Font = "Arial"
        textFormat.Fill.SetSolid(textColor)

        ' Format vertical axis.
        textFormat = chart.Axes.Vertical.TextFormat
        textFormat.Fill.SetSolid(textColor)
        textFormat.Italic = True

        ' Format horizontal axis.
        textFormat = chart.Axes.Horizontal.TextFormat
        textFormat.Fill.SetSolid(textColor)
        textFormat.Size = Length.From(12, LengthUnit.Point)
        textFormat.Bold = True

        ' Format vertical major gridlines.
        chart.Axes.Vertical.MajorGridlines.Outline.Width = Length.From(0.5, LengthUnit.Point)

        ' Format series.
        Dim series = chart.Series(0)
        outline = series.Outline
        outline.Width = Length.From(3, LengthUnit.Point)
        outline.Fill.SetSolid(seriesColor)

        ' Format series markers.
        series.Marker.MarkerType = MarkerType.Circle
        series.Marker.Size = 10
        series.Marker.Fill.SetSolid(textColor)
        series.Marker.Outline.Fill.SetSolid(seriesColor)

        workbook.Save("Chart Formatting.%OutputFileType%")
    End Sub
End Module


